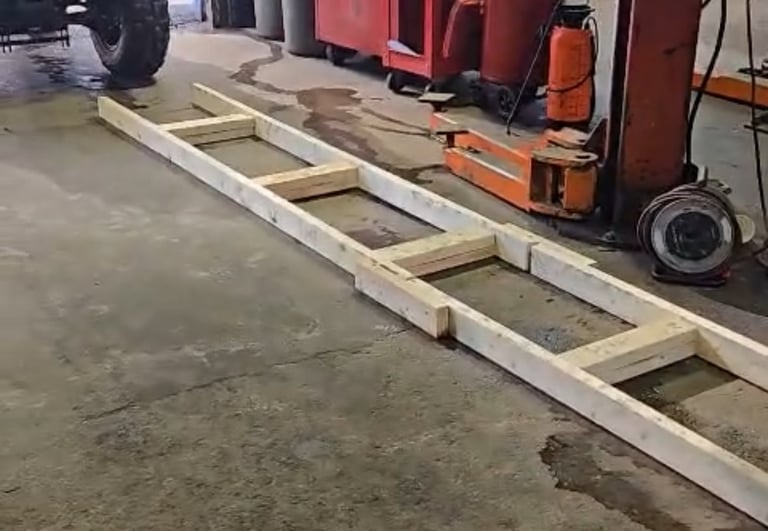
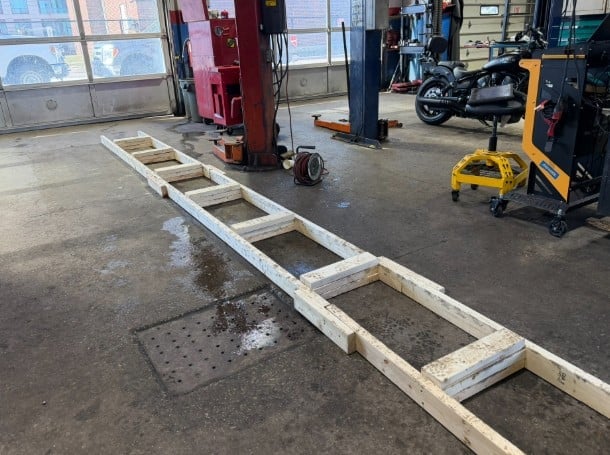
See It In Action
Performance Testing Levels
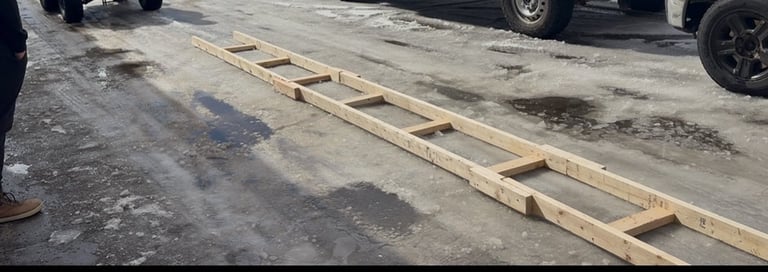
Three levels of real-world testing showcasing our regenerative suspension system's ability to capture energy across different road conditions.
Level 1
Mild Conditions
Standard asphalt surface with minor imperfections. Entry-level energy capture demonstration.
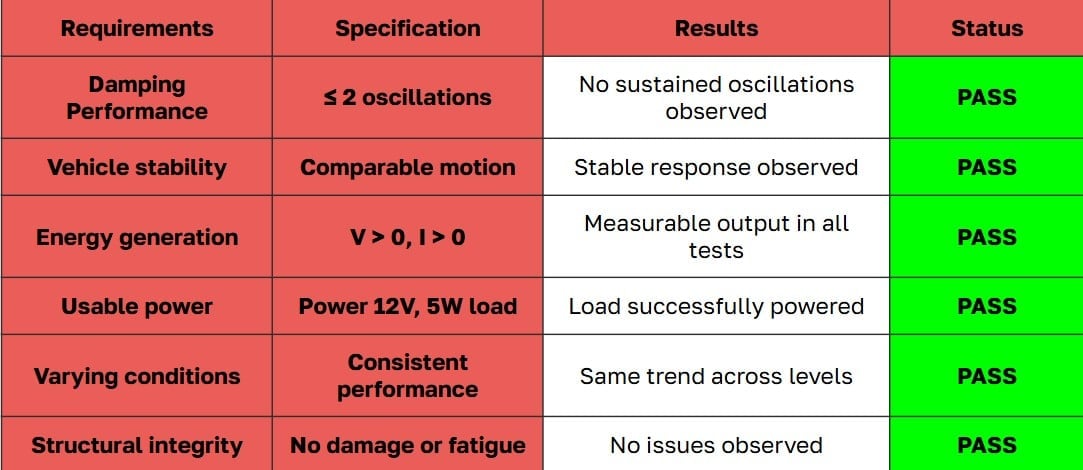
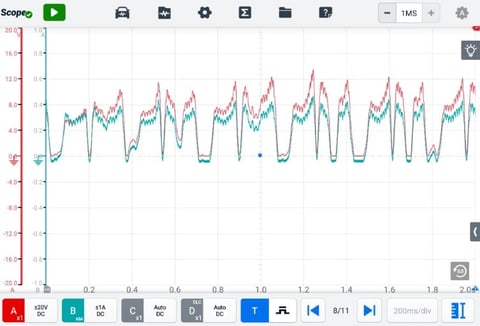
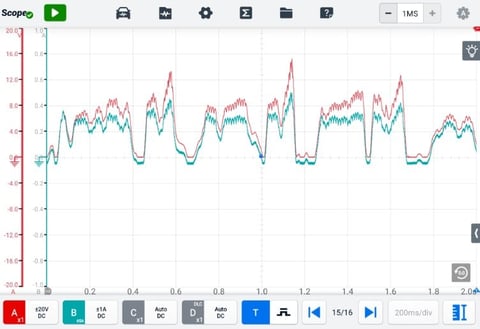
Level 1 Results
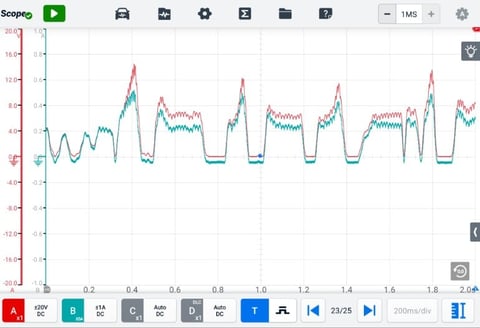
Amps
Voltage
Level 1 Test
Level 2
Moderate Conditions
Enhanced testing with increased suspension movement. Moderate energy recovery rates.
Level 2 Results
Test
Data
Level 2 Test
Level 3
Intense Conditions
Maximum suspension travel and energy capture. The most demanding real-world test scenario.
Level 3 Results
Test
Data
Level 3 Test